Interactive Geo Visualizer
details
summary
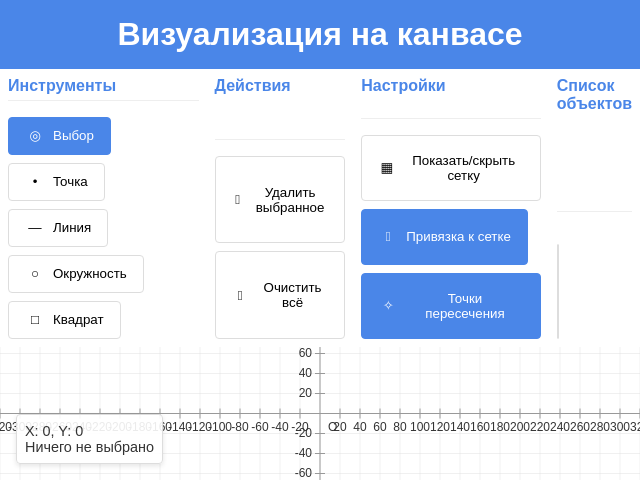
An interactive canvas app to construct and manipulate geometric shapes with a grid.
tags
prompt
Create an interactive canvas visualization app that allows users to construct geometric shapes such as lines, circles, and squares. Ensure vertices and rays are visible, and allow creating line segments. Implement a Cartesian grid for precise alignment. Users should be able to delete and move elements, and new points should automatically appear at intersections with unique names.

## Features
- Use the canvas for drawing and interaction.
- Shapes include lines, circles, squares with visible vertices and rays.
- Present a Cartesian grid for precision and clarity.
- Add and drag points and shapes by clicking and dragging.
- Show point names and display coordinates on hover.
- Enable deleting elements and snapping new points at intersections.

## User Interaction
- Click on canvas to create points and shapes.
- Drag to reposition elements.
- Hover over points to see their names and coordinates.

## Implementation
- Structure app for intuitive use and clear visibility of features.
- Maintain user interactions as fluid and responsive.
- Utilize best practices for creating a seamless and user-friendly interface.
original prompt
Создай визуализацию на канвасе возможности постройки прямой, окружности, квадрата, чтобы видно было вершины, лучи чтобы можно было делать. отрезки, И чтобы сетка была декартова чтобы все по сетке мелкой делалось. чтобы удалять можно было и чтобы новые ставить на пересечении появлялись новые точки с новыми названиями итд

Q: Как пользователь должен взаимодействовать с фигурами на холсте?
A: Клик для создания, перетаскивание для перемещения

Q: Какую информацию нужно отображать для точек и фигур?
A: Точки с именами, координаты при наведении
generation cost summary
model name: claude-3-7-sonnet-latest
response time: 173.66 sec.
result tokens: 15,610
cost: $0.23615700
