Spring Motion Graph
details
summary
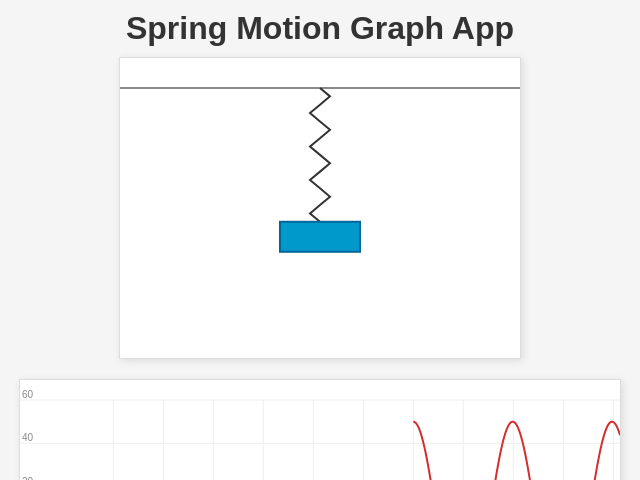
An app visualizing spring oscillation with adjustable stiffness and mass.
prompt
Create an app to display a graph of a spring's motion. Users can adjust stiffness and mass using sliders, and the app updates the oscillation curve in real time. The graph will feature a displacement vs. time curve with a grid, labels, and additional details, along with visual animation of the spring's motion.
original prompt
Build an app to graph a spring’s motion with adjustable stiffness and mass.
Show real-time updates to the oscillation curve as variables change.

Q: Do you want to use sliders, numeric input fields, or both for adjusting the stiffness and mass?
A: sliders

Q: Should the graph display only the oscillation curve (displacement vs. time) or include additional features like a grid or labels?
A: include all

Q: Do you want any visual animation of the spring's motion alongside the graph, or just the curve update in real time?
A: visual animation
generation cost summary
model name: o3-mini-medium
response time: 21.14 sec.
result tokens: 4,487
cost: $0.02019050
