2D Trigonometric Visualizer
details
author: progammar.u.pro
url: https://progammar.u.pro/trigonometric-functions-visualization/2
language: Russian
summary
A web tool to interactively plot trigonometric functions on a 2D grid.
tags
prompt
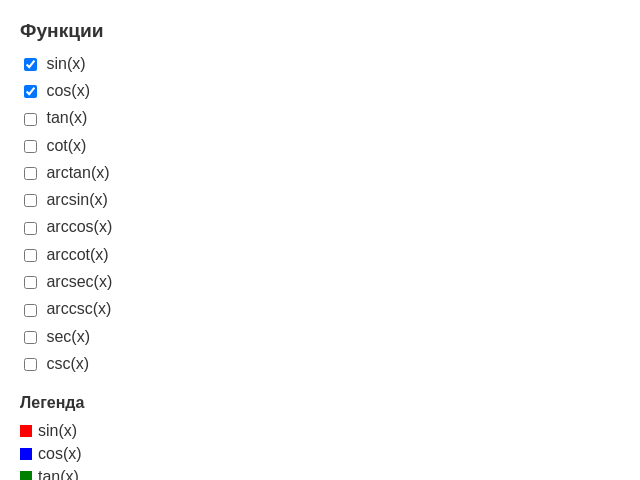
Create a 2D visualization tool for various trigonometric functions such as sine, cosine, tangent, cotangent, arctangent, arcsine, arccosine, arccotangent, arcsecant, arccosecant, secant, and cosecant. These should be plotted on a coordinate plane. Include checkboxes next to each function to toggle their visibility. ## Project overview Develop a user-friendly web tool that graphically represents major and inverse trigonometric functions on a 2D coordinate grid. Users should be able to selectively view functions using interactive controls. ## UI/UX design and flow - Design a clean interface with a prominent coordinate grid in the center of the page. - Include a sidebar or a panel displaying a list of trigonometric functions with corresponding checkboxes. - Users should be able to check or uncheck boxes to show or hide individual function plots. - Ensure that the x-axis ranges from -2π to 2π, allowing users to visualize full cycles of the periodic functions. ## Core functionality and logic - Render plots for each trigonometric function specified over the interval [-2π, 2π]. - Implement interactivity for checkboxes to dynamically update the visibility of each function plot. - Ensure accurate graphical representation of functions, considering factors such as domain restrictions for inverse functions. ## Best practices - Optimize rendering for smooth interactivity even with multiple overlays. - Ensure accessibility features are in place such as keyboard navigation for toggling checkboxes. - Provide clear labels and legends for each function on the graph for easy understanding.
original prompt
Сделай визуализацию всех тригонометрических функций в 2d, таких как синус, косинус, тангенс, котангенс, арктангенс, арксинус, аркосинус, арккотангенс, арксеканс, арккосеканс, секанс, косеканс. Они должны изображаться на координатной плоскости. Должны быть галочки возле функций что бы скрыть или показать их

Q: Какой диапазон значений x вы хотите использовать для графиков?
A: Например, от -2π до 2π

Q: Какие именно тригонометрические функции вы хотите включить в визуализацию?
A: Все перечисленные функции или только некоторые?
generation cost summary
model name: o3-mini-high
response time: 126.03 sec.
result tokens: 16,002
cost: $0.07115130
