Integral Visualization
details
summary
App to visualize integral calculation over a line segment.
prompt
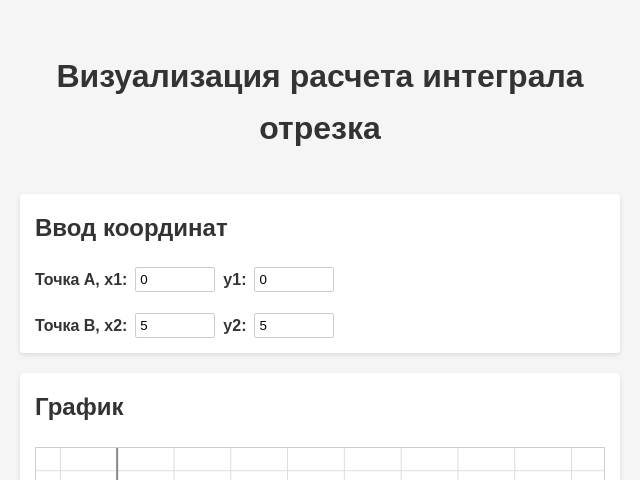
Create an application to visualize the calculation of an integral over a line segment defined by user-input coordinates A and B on a Cartesian coordinate grid. The application should enable users to specify two points: (x1, y1) and (x2, y2).
Sections:
1. Coordinate Input: Allow users to input coordinates for points A and B, specifying the limits of integration.
2. Graph Setting: Display the Cartesian plane, plotting points A and B, and drawing the line segment connecting these points.
3. Integration Visualization: Show the area under the curve specified by the line segment using the definite integral formula: ∫ f(x) dx from A to B.
4. Formulas Display: Include a section that explains the integral formula and the steps taken to compute the area.
5. Interactive Elements: Let users adjust the points A and B dynamically to see instant recalculations and updates on the graph and integral visualization.
Enhancements: Ensure the app is intuitive with interactive and visual aids to clearly show the mathematical concepts. Use best practices in UI/UX to make the app comprehensible, focusing on providing a seamless user experience.
original prompt
Визуализация  расчета интеграла отрезка где можно задавать координаты А и Б отрезка. в декартовой координатной сетке квадратной

При этом нужно визуализировать каким образом через площать расчитывается с формулами и расчетами и нарисованными фигурами на координатной сетке


Q: Какой тип координат (A и B) вы хотите использовать для определения отрезка?
A: Две точки: (x1, y1) и (x2, y2)

Q: Какие конкретно формулы и шаги расчета интеграла вы хотите визуализировать?
A: Формула для площади под кривой: ∫ f(x) dx от A до B.
generation cost summary
model name: o3-mini-high
response time: 100.16 sec.
result tokens: 14,302
cost: $0.06358990
